


2026 U.S. Ag Trade Outlook and USMCA Review
The latest numbers show modest improvement in the U.S. ag trade deficit—but the road to recovery is long.
On February 27, 2026, the USDA released its first Outlook for U.S. Agricultural Trade in 2026, offering a fresh look at export demand, import pressure, and the farm trade balance heading into fiscal year 2026.
For decades, U.S. agriculture consistently ran a trade surplus, with exports exceeding imports for nearly 60 years, driven by strong global demand for bulk commodities like corn, soybeans, wheat, and meat, as well as competitive production advantages. That trend reversed beginning in 2019 as import growth outpaced export gains, while trade disputes and rising South American competition pressured key markets like China.
Today’s shrinking ag trade deficit signals stabilization, but not a full return to the sustained surplus that historically supported U.S. farm profitability.
First Quarter 2026 U.S. Trade Outlook Highlights
USDA now projects FY2026 agricultural exports at $174.0 billion, while imports are forecast at $203.0 billion, resulting in a $29.0 billion trade deficit compared to the $37 billion deficit predicted back in December 2025.
At the same time:
- China’s soybean demand remains limited.
- Brazil and Argentina continue gaining global market share.
- Global shipping and input costs remain fluid.
In addition, the upcoming and highly anticipated USMCA review introduces an added layer of policy uncertainty that will shape commodity pricing, farm revenue potential, and financial strategy for years to come.
What Is the 2026 USMCA Review and Why Does It Matter?
The 2026 USMCA review is the scheduled six-year evaluation of the United States-Mexico-Canada Agreement (USMCA). During this joint review, member nations can renew, revise, renegotiate, or potentially withdraw from the agreement.
For many agricultural producers, this isn’t just a procedure. The results will shape their access to vital markets.
North America trading partners account for nearly one-third of total U.S. agricultural export share. Canada and Mexico alone represent over $58 billion in annual U.S. ag exports and remain the top two foreign buyers of American farm goods.
“USMCA is the foundation of American agricultural trade, supporting farmers in every corner of the country.”
– Brian Kuehl, Farmers for Free Trade
Core commodities that rely heavily on North American trade include:
- Corn
- Dairy
- Beef
- Soybeans
- Specialty Crops
A smooth renewal of USMCA would provide continuity and stability. However, even modest revisions to tariffs, quotas, or compliance standards could influence basis levels, margins, and long-term planning. Renegotiation rhetoric alone can create short-term volatility in commodity markets.
“We make long-range plans when we’re in agriculture. It takes time to pay this off and the stability to know what you’re facing is so important.”
– Tim Gauck, Indiana Farmer
Key Trade Trends Shaping the 2026 Outlook
While we await the results of the 2026 USMCA review, a few key trade trends can be identified from recently released data and the current global market.
1. The Trade Deficit is Narrowing but Persistent.
While the deficit is smaller than earlier expectations, it remains structurally negative. Strong import demand—particularly for horticultural products, tropical goods, and specialty foods—continues to outpace export growth.
For producers, this means global competition remains intense, but there may be growing opportunities to differentiate through origin, quality, and traceability, particularly as some consumers place increased value on domestically produced goods.
2. Soybeans and Oilseeds Will Face Ongoing Pressure.
Soybean exports are forecast at $18.3 billion for FY2026, reflecting continued headwinds. Oilseeds and product exports were also revised lower to $30.1 billion.
China remains largely absent from prior peak levels of U.S. soybean purchasing. Meanwhile, Brazil has expanded production capacity and strengthened export dominance, and Argentina continues to adjust its trade positioning, particularly in protein markets.
Producers should consider stress-testing soybean revenue projections and exploring diversification strategies, greater marketing flexibility, or cost-discipline measures to help offset continued export headwinds and rising global competition.
3. Grains are Showing Relative Strength Right Now.
There is brighter news in grains.
USDA projects $42.4 billion in grains and feeds exports, with corn exports raised to $18.5 billion. Demand strength in select markets is helping offset some oilseed weakness.
This divergence underscores the importance of commodity-specific strategy. Not all sectors are experiencing the same degree of pressure. Producers may want to evaluate near-term marketing opportunities in grains while maintaining disciplined risk management, recognizing that stronger export demand in corn and feed markets does not necessarily eliminate broader volatility across the sector.
4. Livestock and Dairy Export Outlook is Giving Mixed Signals.
The February export forecast of $39.1 billion for livestock, poultry, and dairy exports is slightly lower than December’s $39.3 billion projection, reflecting a modest downward revision rather than meaningful growth.
While dairy exports increased to $9.8 billion due to steady global demand, beef export value was revised slightly lower to $7.9 billion, as Brazil surpasses the United States in global beef production.
Producers should review cash flow projections and consider adjusting production or marketing plans to protect profitability. Strategies such as forward contracting, cost management, and closely monitoring global demand trends can help mitigate risk.
5. Export Markets are Diversifying—But is it Enough?
Trade missions and new agreements in Malaysia, India, Central America, and South America highlight efforts to diversify away from heavy reliance on China. But the central question remains: Can diversification meaningfully offset lost Chinese demand?
To put that question into perspective, let’s take a look at the forecasted global market share of U.S. ag export trade.
U.S. Ag Export Market Share Outlook in 2026
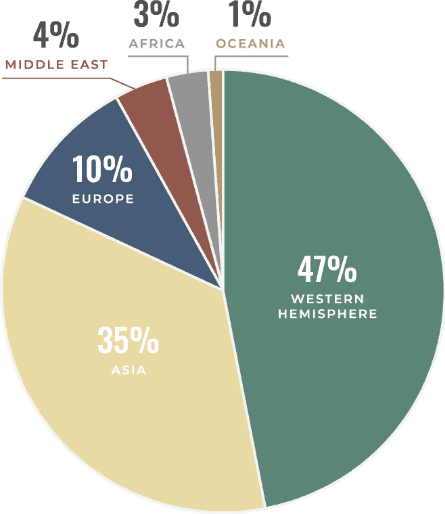
Source: USDA ERS Outlook for U.S. Agricultural Trade: February 2026
The short answer is, yes. According to the data, China is expected to account for less than seven percent of U.S. ag exports in 2026. While expanding into other global markets has the potential to reduce dependence on Chinese demand, successful execution of new trade agreements will be key.
One market to watch is Venezuela. The U.S. is the second-largest exporter of agricultural products to Venezuela, holding approximately 26 percent market share. Key exports include soybean meal, corn, wheat, soybeans, and rice. While promising, the market presents geopolitical and payment risks.
What This All Means for Farm Financial Planning in 2026
Given the current outlook, producers should consider several proactive steps:
- Stress-test revenue assumptions. Export variability and global competition require conservative forecasting.
- Monitor USMCA review and trade developments closely. Policy shifts can move markets quickly, particularly in export-heavy commodities.
- Maintain liquidity flexibility. Working capital strength becomes a competitive advantage when markets shift.
- Evaluate refinancing opportunities early. Adjusting debt structure before policy-driven volatility can reduce exposure.
For many export-focused operations, profitability in 2026 will depend not only on yields and input costs but also on export access and policy stability.
Don’t Wait for Trade Policy to Dictate Your Financial Strategy
USDA reports provide macro-level direction. But producers need tactical insight.
AgAmerica’s Ag Economy Outlook Report translates federal forecasts into actionable strategies. Download this free report to learn more about how current market trends could impact your operation, pricing, and long-term financial strategy.