


Understanding Ag Trade-Weighted Foreign Exchange Rates
Exchange rates are often said to be the single most important price for any economy with significant trade, but few understand why.
The economic lessons of the past underscore the influential role trade-weighted foreign exchange rates play in international agricultural trade. But how exactly do they impact U.S. agricultural trade and what factors influence their variability?
Keep reading to explore the intricacies of trade-weighted foreign exchange rates with insights from AgAmerica’s Chief Economist Dr. John Penson.
The Historic Impact of Trade-Weighted Foreign Exchange Rates
During the early 1980s, the real value of the U.S. dollar increased by 57 percent as a result of the tight monetary policy actions taken by the Fed to reduce high inflation.
The resulting stronger dollar undermined the competitiveness of U.S. agricultural exports which caused agricultural commodity prices to decline. The combination of lower commodity prices and higher interest rates contributed to the sharp decline in net farm income and farmland values in the 1980s.
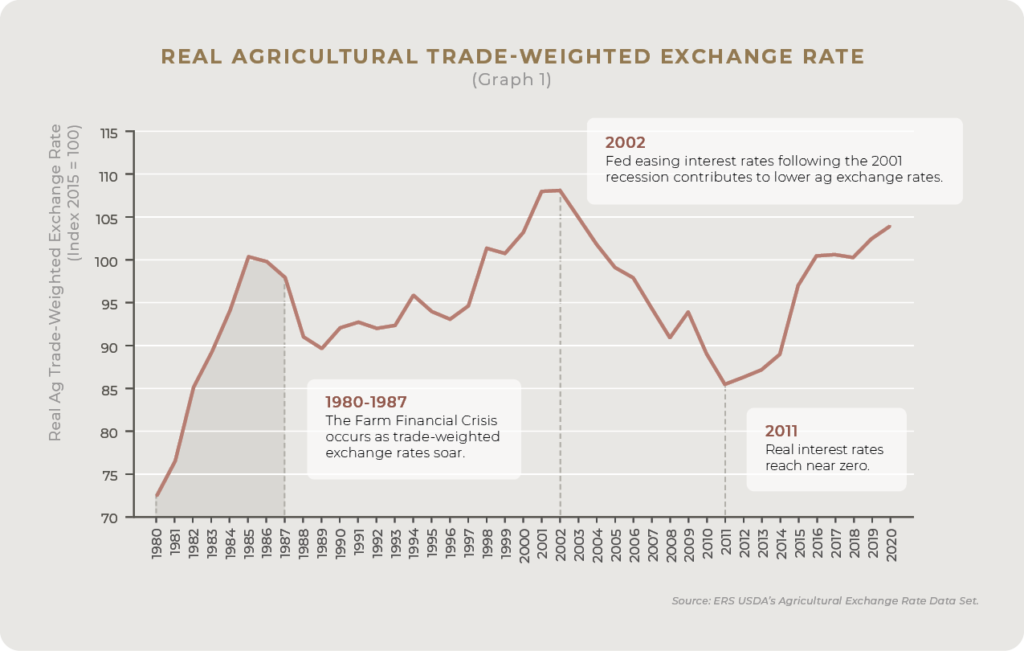
The 1980s farm financial crisis—which lasted through the mid-1980s—led to severe financial stress for many farmers and ranchers across the nation. Bankruptcies rose and many rural banks failed. The opposite effect was observed during the 2000s, when the U.S. dollar depreciated sharply and resulted in record-level agricultural exports through 2014. The increasing strength of the U.S. dollar beginning in 2015, however, dampened export demand over the remainder of the decade.
Twenty percent of annual agricultural production is typically exported to overseas buyers. Understanding the factors that influence exchange rate movements is vital to understanding trends in agricultural trade and their implications for producers of commodities dependent on viable export demand.
Influential Factors of Exchange Rate Fluctuation
Through these historical events, economists have come to identify four key factors that contribute to the variability in real trade-weighted exchange rates:
- Interest rate and inflation rate differentials;
- Demand and supply of domestic currencies;
- Comparative demand and supply of foreign currencies; and
- The volume of trade between nations.
Other factors that have a longer-run effect include trends in national public debt, political stability, and economic performance.
1. Interest and Inflation Rates
The strength or worth of a nation’s currency is based upon the demand for its currency to complete trade or investment transactions. An increase in the U.S. real interest rate (nominal rate of interest minus the rate of inflation) relative to real foreign interest rates increase the demand for U.S. dollars. Other things constant, this increase causes the real trade-weighted exchange rate to rise, which means it takes more units of a foreign currency to purchase U.S. agricultural commodities.
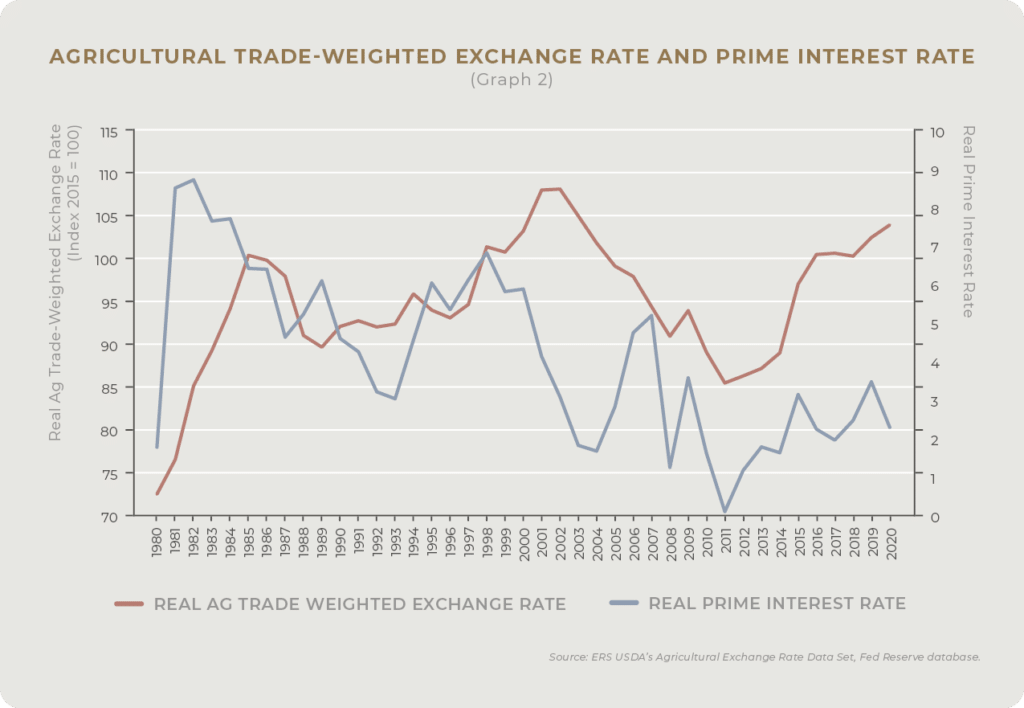
The graph above contrasts historical trends in the real U.S. trade-weighted exchange rate for agricultural exports in general and the U.S. real prime interest rate. While this graph omits the real interest rate on currencies of trading partners and other variables affecting exchange rates, the high positive correlation between these two variables (83 percent) illustrates the delayed cadence between U.S. real interest rates and this real trade-weighted exchange rate.
2. Demand and Supply of Domestic Currency
An increase in the differential between U.S. real interest rates and rates associated with foreign currencies increases the demand for U.S. dollars. For a given supply of dollars, this increase in demand will cause the trade-weighted exchange rate to increase. The resulting stronger dollar increases U.S. purchasing power abroad. But it also reduces the competitiveness of U.S. exports in foreign markets. A weak dollar, on the other hand, makes U.S. agricultural products less expensive to foreign buyers, but reduces the purchasing power of U.S. buyers in international markets. Among other things, this makes imports of farm inputs like fertilizer and fuel more expensive.
To illustrate, assume the real trade-weighted exchange rate index for agricultural exports increases from 110 to 120. This means the U.S. dollar appreciated by 9.1 percent, making US agricultural exports more expensive. This reduces export demand for U.S. agricultural commodities, which lowers prices for exported commodities like cotton, soybeans, tree nuts, and pork, and lowers farm revenue in the U.S. If, on the other hand, the real trade-weighted exchange rate fell from 120 to 110, the U.S. dollar would depreciate by 8.3 percent, making U.S. agricultural exports less expensive, and lead to higher commodity prices and farm revenue in the U.S.
If Federal Reserve begins in 2022 to taper its monthly purchases of government and mortgage-backed securities in response to rising inflation concerns, the U.S. money supply will grow more slowly. Fewer U.S. dollars in currency markets, other things constant, will cause real interest rates in the U.S. to rise. As explained above, this will increase the strength of the dollar and the U.S. real agricultural trade-weighted exchange rates. Agricultural commodity prices in the U.S. and hence revenue of American farmers would subsequently fall.
3. Demand and Supply of Foreign Currency
Movements in foreign currency markets also affect the real trade-weighted exchange rates primarily through the differential between the U.S. and foreign real interest rates. If the Federal Reserve begins tapering back its purchases of government and mortgage-backed securities while central banks in other major economies continue to follow quantitative easing strategies, the U.S. real interest rate differential will increase and cause U.S. commodity prices and farm revenue to decline. The opposite is true, should the Federal Reserve continue its monetary easing policies with other major central banks begin to taper back their net asset purchases.
4. Commodity Type and Weight
The Federal Reserve reports a broad real multilateral trade-weighted foreign exchange index based on the volume of merchandise trade, adjusted for relative inflation, between the U.S. and 20 different countries around the globe. This includes other goods and services besides agricultural commodities. This index tracks the dollar’s relative performance during periods of economic expansion and recession. This and similar multilateral exchange rate indices calculated by other central banks and organizations like the International Monetary Fund do not account for the uneven impact exchange rates have on specific commodities or groups of commodities. The USDA reports trends in real trade-weighted exchange rates for 49 specific U.S. agricultural commodities and commodity groupings. The weights assigned to the individual commodities capture their relative importance to total U.S. agricultural exports. Research has shown that real multilateral trade-weighted exchange rates by commodity do a much better of explaining commodity-level export demand than broader real trade-weighted exchange rates for total merchandise discussed above.
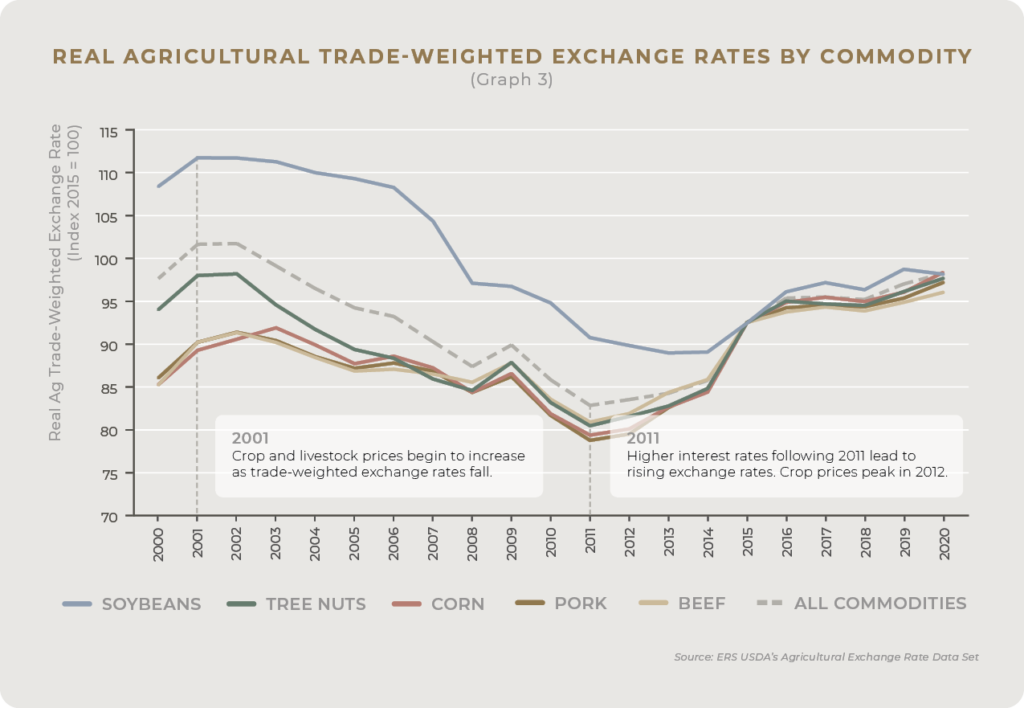
The trend in the real trade-weighted exchange rate for total agricultural exports displayed in the two previous graphs is indicated by the dotted line over the 2000-2020 period in the above graph. Crop and livestock prices rose significantly (76 percent and 43 percent) over the 2001-2011 period as the real trade-weighted exchange rate for agricultural exports declined. As the exchange rate rose in the last decade, crop and livestock prices declined by 21 percent and 7 percent.
This graph also shows the trend in the individual real trade-weighted exchange rates for the nation’s top five agricultural exports according to the USDA. One notable takeaway is the spread between soybeans and the other four major exported commodities. There are two reasons for this.
First, the value of soybean exports relative to total agricultural exports was substantially greater than the other top commodities identified in this graph.
Second, it also reflects the strength of the dollar relative to the currencies of the countries importing these specific commodities.
In the case of soybeans, the weight of 61 percent attributed to China means the Chinese currency and inflation rate has the biggest impact on U.S. soybeans’ real trade-weighted exchange rate. Other national currencies such as the Mexican peso, Canadian dollar, and Japanese yen play a more significant role for the other top five commodity exports that have a more balanced spread, as shown in the above pie graph.
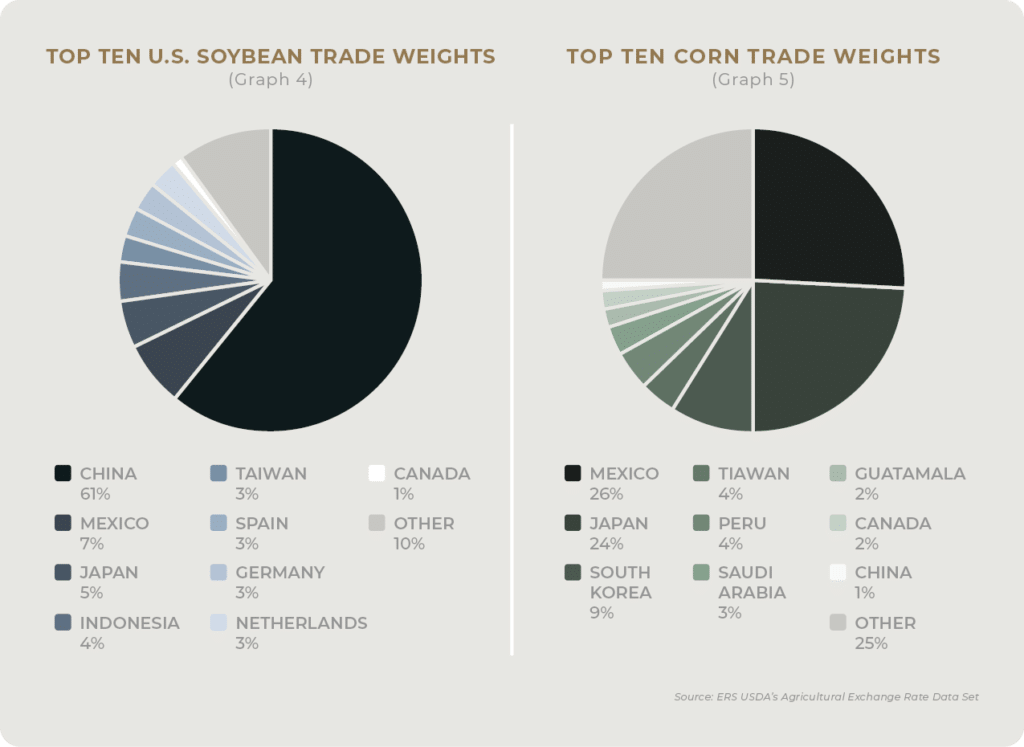
To put this concept into a more visual context, consider the trade weights for soybeans and corn in the pie graphs below. In the case of soybeans, 61 percent of the total weight is assigned to the real exchange rate between the U.S. dollar and Chinese yuan. The top 10 corn trade weights are more dispersed than soybeans with Japan registering the largest trade weight at 24 percent. The “other” category for corn is 25 percent as compared to only 10 percent for soybeans.
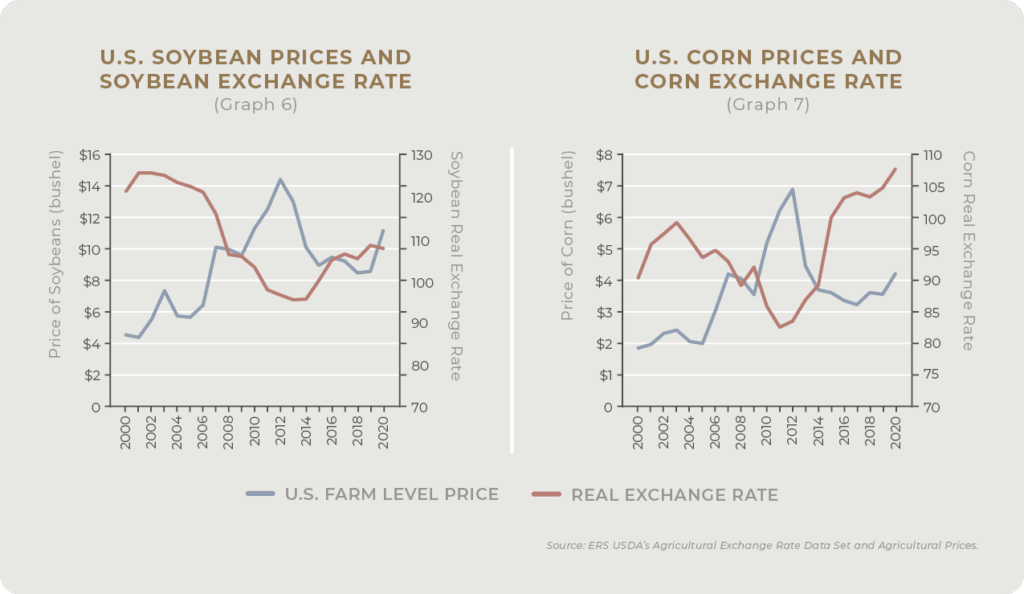
Let’s take this analysis one step further by examining the relationship between the real trade-weighted exchange rates and the prices American farmers received for these two commodities. The graph below demonstrates the strong negative correlation between these two trends. As the real trade-weighted exchange rates for these two commodities decreased (increased), the price received by American farmers rose (declined) which in turn increases (decreases) the revenue they receive.
The Impact of Foreign Exchange Rates on U.S. Agricultural Trade
All four of the above factors (real interest rates, the demand and supply of domestic and foreign currency, and the significance of an individual commodity) are interconnected in their impact on the real trade-weighted foreign exchange rate and, in turn, on U.S. agricultural trade. While long-term growth of U.S. agricultural exports is mainly driven by foreign economic conditions, agricultural exports in the near term are largely influenced by shifts in exchange rates.
To summarize, if the real trade-weighted exchange rate for a commodity increases, American farmers receive less revenue for that commodity because the cost importers must pay to acquire U.S. dollars to complete the purchase has increased. This applies vice versa as well, indicating the important relationship between real trade-weighted foreign exchange rates and the competitive edge of American farmers in the global market.
Download your free copy of Global Trade and U.S. Agriculture to learn more about the factors that influence the global trade market for U.S. agriculture and what farmers should be keeping an eye on in 2022.
You can also visit AgAmerica’s Agricultural Economics Page to find more insights from Chief Economist Dr. John Penson.