


How Government Farm Payments Are Shaping the 2026 Farm Income Forecast
The first USDA farm income forecast of 2026 underscores the growing role of government farm payments in stabilizing the farm economy.
According to the latest projections from the USDA Economic Research Service (ERS), net farm income in 2026 is expected to decline less than one percent year-over-year, following a projected 21 percent increase from 2024 to 2025.
That marks a significant revision from the September 2025 farm income forecast, which had anticipated a 41 percent jump in net farm income. (December’s farm income forecast was canceled due to the government shutdown.)
Under the surface, performance continues to vary by commodity. Total cash receipts are anticipated to fall three percent in 2026. Animal product cash receipts are projected to decline six percent, while crop cash receipts are expected to increase one percent. At the same time, government farm payments are anticipated to comprise as much as 30 percent of total net farm income in 2026.
As farm expenses remain elevated and liquidity concerns continue to pressure producers, the growing role of government farm payments to support income is becoming an increasingly important topic of conversation.
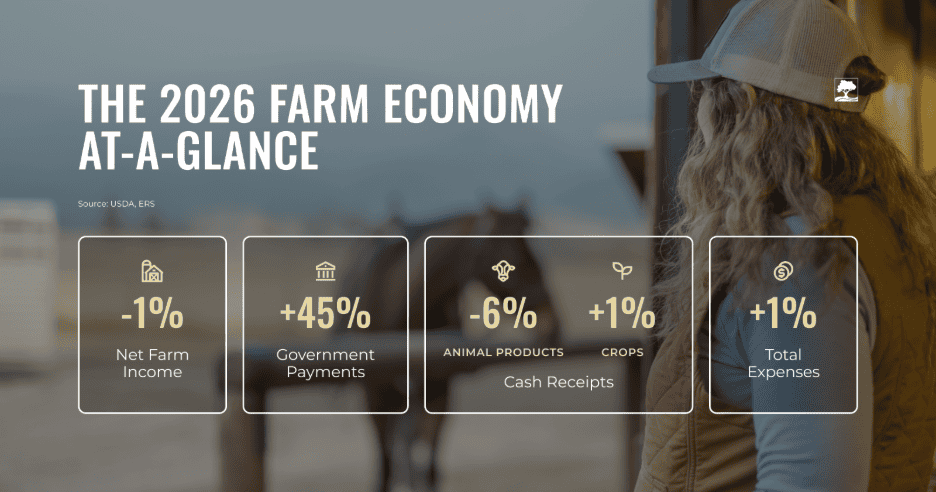
Bottom line: Net farm income is projected to dip slightly in 2026 after a 21 percent increase in 2025. Animal cash receipts are forecasted to drop after a stronger year in 2025, while crop receipts are expected to remain moderately stable. Despite $44.3B in government farm payments forecasted to comprise nearly 30 percent of total net income, a restricted credit environment persists.
What Programs Are Included in Government Farm Payments?
Government farm payments represent direct federal support to agricultural producers. These payments are included in total net farm income, meaning they directly influence profitability calculations.
Major components include:
- Agriculture Risk Coverage (ARC) – Revenue-based support tied to county or individual revenue shortfalls.
- Price Loss Coverage (PLC) – Payments triggered when market prices fall below statutory reference prices.
- Supplemental and ad hoc disaster assistance programs – Emergency relief tied to weather, market disruptions, or special legislation.
- Conservation programs – Payments tied to land stewardship and resource management.
- Miscellaneous programs – Smaller or commodity-specific support initiatives.
Distribution of Direct Government Farm Payments in 2026
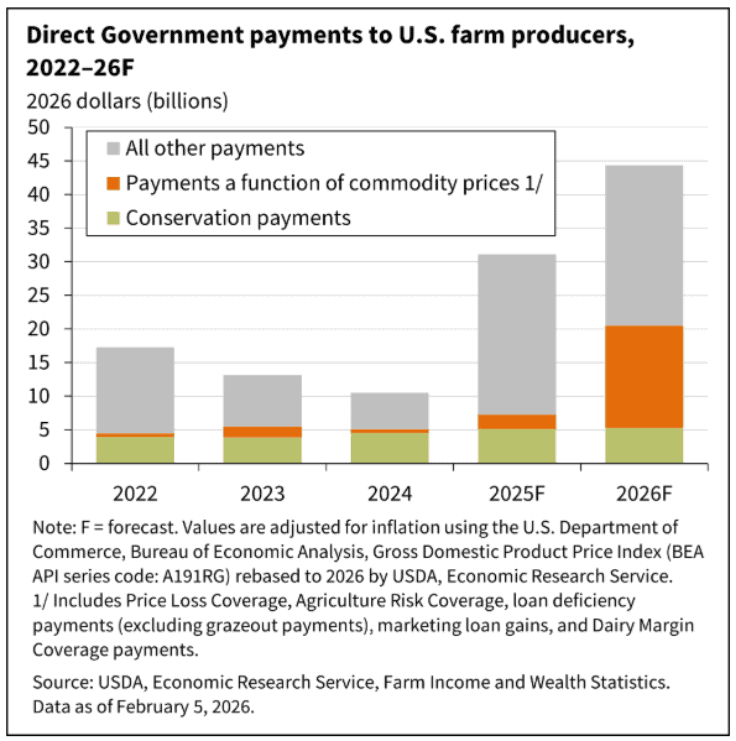
Supplemental and ad hoc programs account for the largest share, underscoring how much recent farm income support has relied on temporary or emergency measures rather than permanent farm bill programs.
How Do Government Farm Payments Affect the Farm Economy and Policy?
Government farm payments serve as direct income support, helping offset:
- Commodity price declines
- Production losses
- Market disruptions
- Weather-related disasters
During downturns, these payments can stabilize cash flow and prevent more severe income contractions. However, analysts have raised questions about whether the crop safety net has expanded beyond its intended scope, particularly as total government farm payments approach what some describe as the “$40 billion rule of thumb” threshold.
Critics argue that elevated government payment levels can:
- Reduce pressure to cut costs
- Distort planting or marketing decisions
- Delay necessary structural adjustments
Supporters counter that volatility, global competition, and rising input costs justify a stronger safety net.
As future farm bill discussions unfold, the balance between stabilization and market discipline will likely remain central.
Outside of Government Farm Payments, How Are Farm Financial Conditions in 2026?
While government farm payments are supporting short-term earnings, deeper structural financial pressure persists in several key areas.
Rising Farm Debt
Total farm sector debt continues to trend upward, reflecting:
- Higher operating loan usage
- Elevated land values
- Increased refinancing activity
Long-term leverage has grown steadily, raising questions about repayment capacity if income softens further.
Farm Loan Repayment Rates
Financial reports indicate softer repayment performance in agricultural loan portfolios. Purdue University’s Ag Economy Barometer similarly points to rising financial stress among producers.
Farm Bankruptcy Trends
Farm bankruptcies continued to climb through 2025, signaling that income support alone has not eliminated financial strain across all regions or commodities.
Farm bankruptcy risk factors include:
- Elevated input costs
- Interest rate pressure
- Regional disparities
- Commodity price volatility
- Dependence on policy decisions
- Uncertainty around future payment levels
Government farm payments are supporting earnings, but broader financial stress indicators remain elevated.
What This Means for Key Stakeholders
For Farmers and Ranchers
- Income planning must remain localized and commodity-specific.
- Crop-heavy operations may face tighter margins than livestock-focused producers.
- Cash flow protection and working capital management are critical.
For Agricultural Lenders
- Monitor repayment capacity and liquidity trends.
- Evaluate exposure in crop-dominant regions.
- Assess collateral values amid shifting income forecasts.
For Policy and Extension Professionals
- Monitor uneven regional impacts.
- Evaluate sustainability of elevated income support levels.
- Keep an eye on policy recalibration discussions in farm bill negotiations.
Partner with a Trusted Lender to Create Your Long-Term Financial Plan
The 2026 forecast shows modest stabilization in net farm income with a widening divergence between crop and livestock receipts. Government farm payments are playing an increasingly central role in profitability as financial stress indicators persist.
Income support through government intervention has stalled sharper forecasted income declines in 2026, but it has not eliminated structural risk. Strategic planning remains essential.
Download AgAmerica’s Ag Economy Outlook Report to learn specific strategies to support a stronger long-term financial plan for your operation.