


Farm Income in 2021
According to the latest USDA Farm Sector Income Forecast, farm income is expected to reach its highest level since 2013—even in the face of higher production costs.
The USDA released the last of three farm income data reports in 2021 on December 1, and with it came statistical evidence that price rallies across a majority of ag sectors have positively impacted gross farm income this year.
December Report Highlights: Farm Income in 2021
The net farm income forecast for 2021 was boosted to $116.8 billion—a three percent increase from September’s farm income forecast and a more than 23 percent increase from the final 2020 net farm income estimate of $94.8 billion.
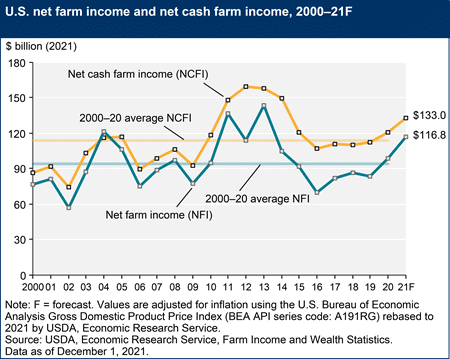
Likewise, net cash farm income is expected to increase nearly 15 percent to $133 billion. This form of measurement skews slightly higher than net farm income as it does not include economic depreciation or noncash income sources, such as change in inventories, that are reflected in the net farm income forecast.
From an ag commodity standpoint, cash receipts are expected to increase across all major ag commodity markets, with the exception of vegetables, melons, fruits, and nuts mostly due to lower prices in the global ag trade market.
Beyond gross farm income, the USDA’s December 2021 Farm Sector Income Forecast report also includes year-over-year shifts in production costs, direct government payments, and farm sector equity.
Production Costs
When diving into the farm income report a little deeper, there is evidence that price rallies are also leading to higher production costs across the board—from feed to cash rents. Total production expenses are expected to increase more than eight percent to $387.6 billion in 2021. The highest increases in production costs include:
- Fuel and oil – $15.8 billion (a 32.2 percent increase)
- Poultry and livestock products – $33.5 billion (a 15.6 percent increase)
- Feed – $64.4 billion (a 13.4 percent increase from 2020)
- Fertilizer – $27.5 billion (a 12.5 percent increase)
- Interest – $20.6 billion (a 6.6 percent increase)
- Cash rents – $18.9 billion (a 5.1 percent increase)
- Labor – $37.9 billion (a 3.5 percent increase)
- Seed – $400 million (1.8 percent increase)
Pesticide was the only major expense category to see a slight reduction in total expenses with a less than one percent decline. Fertilizer prices are expected to increase further in the next trade report as the price of natural gas continues to drive up nitrogen costs.
Direct Government Payments
Historic disruption in the food supply chain contributed to record direct government farm payments in 2020 at $45.7 billion, or 48 percent of total net farm income in 2020. This year, direct government farm payments are expected to drop to $27.2 billion—23 percent of farm income in 2021.
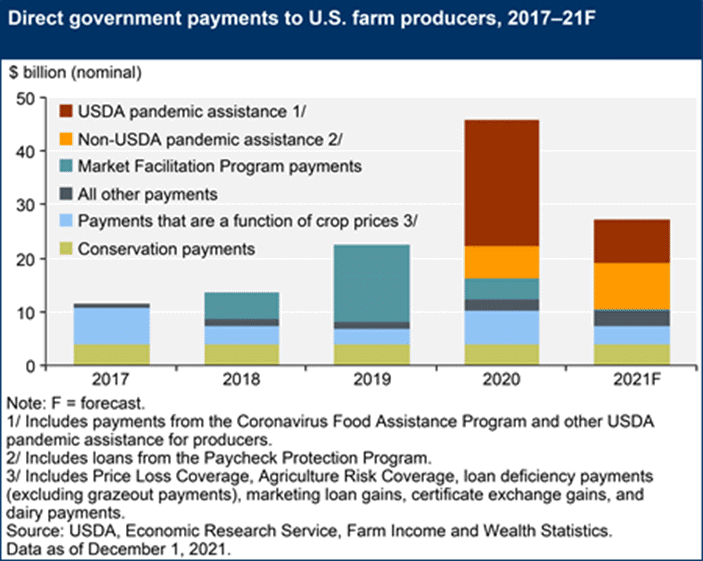
Despite this 40 percent drop in direct federal aid from 2020 to 2021, total direct government payments made to farmers are still comparatively higher than years prior. Major direct government farm program payments in 2021 include:
- Supplemental and ad hoc disaster assistance payments – $19.9 billion (a 59 percent decline from 2020)
- Paycheck Protection Program (PPP) – $8.7 billion (a 31 percent increase)
- Coronavirus Food Assistance Program (CFAP) – $8 billion (a 66 percent increase)
- Conservation Payments – $4 billion (a four percent increase in 2021)
- Price Coverage Loss (PCL) – $2.1 billion (a 57 percent decline)
- Agriculture Risk Coverage (ARC) – $95 million (a 93 percent decrease)
- Dairy Margin Coverage Program – $1.1 billion (an 82 percent increase due to higher feed costs)
- Market Facilitation Program (MFP) – $83.9 million, a significant drop from 2018-2020 as these were residual payments from the impacts of the U.S.-China trade war, and no new payments were issued by the USDA in 2021.
Farm Sector Equity
Farm sector equity is the “difference between farm sector total assets and total debt” and is forecasted to increase by nearly three percent in nominal terms.
The increase in U.S. farmland values this year is contributing to the nominal increase in total farm sector equity. Other contributing factors to the stability in farm sector equity in 2021 include:
- Total farm debt – The USDA anticipates a decline of less than one percent when adjusted for inflation.
- Debt-to-assets – This is forecasted to stay relatively stable at 13.91 in 2021.
- Working capital – Higher market prices are contributing to a projected increase of 9.6 percent in 2021.
Outlook for Farm Income in 2022
The estimated increase in farm working capital combined with an overarching increase in most major ag commodity cash receipts points towards a year of opportunity for American farmers and ranchers in 2022.
One factor hindering some farmers’ thoughts on expansion is escalating production expenses, particularly for growers impacted by higher fertilizer costs. The future of direct government payments to U.S. farmers and ranchers is also creating some uncertainty, as pandemic relief programs expire but current debates in ag funding legislation could lead to an influx in conservation payments in the coming years if passed.
Despite these ambiguities, the U.S. agricultural market is expected to experience record-breaking exports in 2022 which will hopefully help offset higher production costs and lower government payments.
Let Nothing Stand in Your Way with AgAmerica
At the end of the day, there are a lot of uncontrollable factors that impact the farmer’s bottom line. Through it all, American farmers and ranchers shoulder the risk to continue providing for others. As a nationwide ag lender, AgAmerica is committed to easing this burden of responsibility by providing flexible financial structures that help clear the path towards a more resilient operation.
From conventional products to transitional solutions, we’re in the business of equipping our clients with the financial freedom needed to thrive.
Contact one of our financial experts today to tell us more about your operational goals and learn about the resources available to you to make it happen.