


Report Recap: The 2023 Farm Income Forecast
Read highlights from the first USDA farm income forecast report in 2023.
Farmers ended the year in a solid financial position in 2022. In the first farm income forecast report in 2023, the USDA reports farm income increasing by nearly 16 percent in 2022 from 2021 to $162.7 billion. High commodity prices and strong global demand for U.S. ag exports are two of the main contributors to record high income last year.
In 2023, the USDA predicts a slight softening in net farm income due to lower commodity prices combined with the ongoing trend of higher production costs.
Before we get into farm income report specifics, you may be wondering how USDA farm income forecasts are calculated. Gross farm income is the total value of agricultural output combined with total government payments (these can be anywhere from ad hoc disaster relief payments to conservation or crop insurance program payments).
Net farm income is total farm production expenses subtracted from the gross net farm income total. Net cash farm income is typically higher than net farm income as it does not include income adjustments, such as depreciation and inventory adjustments that transfer value across tax years.
Now that we understand a little more about how the USDA calculates net farm income and net cash farm income, here are the high-level takeaways from the first quarter 2023 farm income forecast report.
Key Takeaways from the USDA’s Farm Sector Income Forecast Report
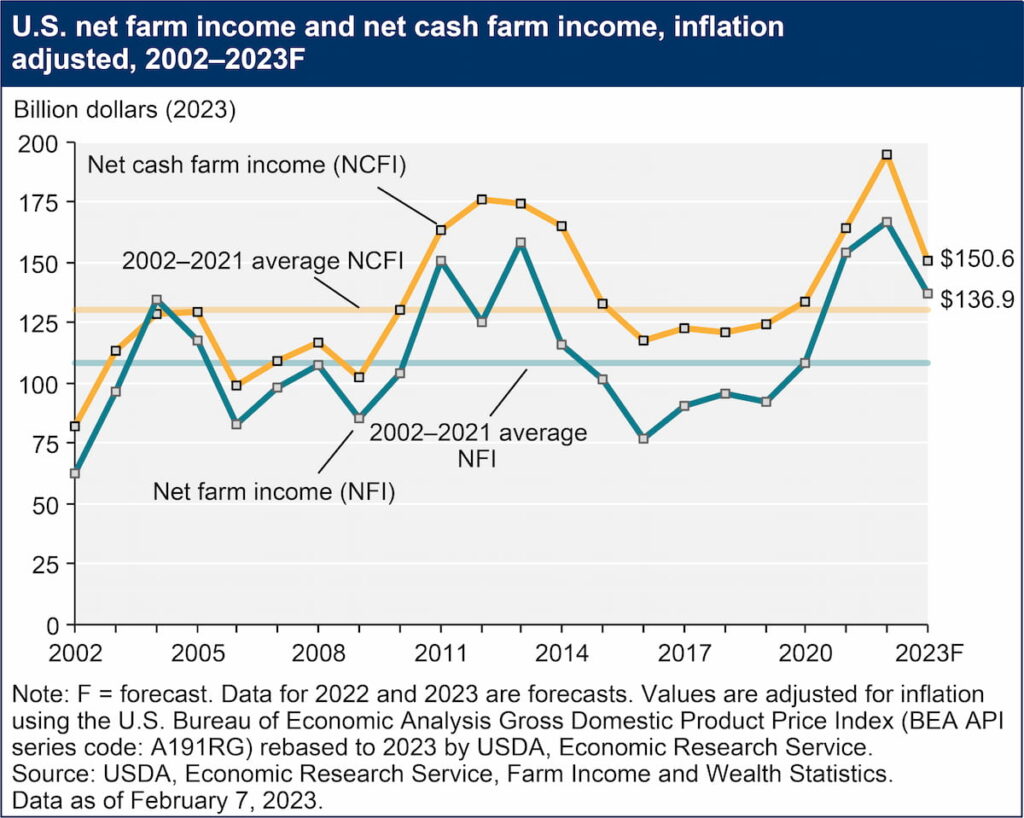
- Net farm income is expected to decline 15.9% after three consecutive years of growth to $136.9 billion in nominal terms in 2023 after a record high in 2022.
- Net cash farm income is expected to decline 20.7% to $150.6 billion in nominal terms from 2022 to 2023.
- Direct government payments are forecasted to decrease by 34.4%.
- Total production costs are forecasted to increase by 4.1% (1.3% in inflation-adjusted terms) to $18.2 billion.
- Farm sector assets, debt, and equity are all expected to increase (5.2, 6.2, and 5%, respectively).
Four Factors Affecting The 2023 Farm Income Forecast
Here are some main contributing factors influencing this expected shift in net farm income in 2023.
1. Lower Farm Cash Receipts
For crops, lower prices are expected to more than offset higher quantities sold. Corn, soybean, cotton, fruit, nut, vegetable, and melon cash receipts are all expected to decrease due to lower prices. Even so, corn and soybean receipts are still forecasted to be above the 2002-2021 average. Wheat receipts are predicted to increase due to growth in quantities sold. Lower prices are expected to pressure corn and soybean cash receipts, while increased movement could help wheat receipts, but they’re not going to increase enough to offset lower government payments and higher production expenses. Nevertheless, the 2023 forecast for soybean cash receipts would still be the second highest on record, and the corn forecast is expected to be the third highest.
Estimated change in crop cash receipts from 2022 to 2023:
- Corn: -7.1%
- Soybeans: -10.6%
- Cotton: -4.8%
- Fruits and Nuts: -3.1%
- Vegetables and Melons: -11.2%
- Wheat: +1.2%
For livestock, lower prices and lower quantities sold are expected to lower receipts. Receipts for dairy, hogs, broilers, and chicken eggs are expected to decline. Cattle receipts are forecasted to remain relatively stable. Dairy farm businesses are forecast to see the most significant decrease in average cash net farm income in 2023, at about 40 percent, after a substantial forecast increase in 2022.
Estimated change in livestock and livestock product cash receipts from 2022 to 2023:
- Cow/Calf: -0.4%
- Dairy: -16.9%
- Broilers: -10.0%
- Hogs: -5.4%
- Eggs: -26.1%
2. Direct Government Payments
After reaching a record high of $45.6 billion in 2020, direct government farm program payments decreased to $25.9 billion in 2021. They are forecast to decline further to $15.6 billion and $10.2 billion in 2022 and 2023, respectively.
One exception to this expected decline is conservation program payments. Payments from the financial assistance programs of USDA’s Farm Service Agency (FSA) and Natural Resources Conservation Service (NRCS) are expected to be $4.0 billion in 2023, up $13 percent from the 2022 forecast amount.
Since commodity reference prices will not be considered for updating until the 2023 Farm Bill is finalized, Farm Bill commodity payments under the Agriculture Risk Coverage (ARC) and Price Loss Coverage (PLC) programs are expected to decline by $303.4 million, or 81.4 percent, in 2023 to $69.1 million.
3. Higher Input Costs
Farm production costs were a hot topic in 2022—and it looks like that trend will continue in 2023. The report indicates that farm expenses are projected to have increased by 11 percent in 2022 from 2021 when adjusted for inflation.
The USDA expects production costs to increase more modestly in 2023 by 1.3% inflation-adjusted terms. Interest expenses, livestock and poultry purchases, and labor make up the most significant increases in input costs. Fertilizer, feed, and net rent costs are expected to decline.
Fuel and oil expenses are projected to fall nearly 15 percent to $17.1 billion in 2023. Interest expenses (including operator dwellings) are forecast to rise by 22.4 percent to $33.8 billion in 2023, following a 42.1 percent increase in 2022. USDA experts say this reflects expectations that debt levels for the sector and interest rates will continue to grow in 2023, although at a slower pace than in 2022.
4. Farm Equity and Debt
Equity, assets, and debt are all expected to rise, with total farm debt increases slightly outpacing equity and assets. This indicates a probable decline in farm sector solvency in 2023 due to farmers offsetting higher production costs with more borrowed capital. The good news is forecast ratios remain slightly above the 10-year average, and farm bankruptcies are at their lowest levels since 2004.
All in all, farmers are in a strong financial position right now to borrow, scale, and grow their profit margins moving forward.
Stress Less and Prepare More with AgAmerica
As a farmer-centric company, AgAmerica is constantly seeking ways to help farmers thrive in the good times and sleep well during the hard times. Our singular focus on the ag sector means our team of land lending experts is well-versed in current market conditions. We can anticipate your needs and adjust your financing to prevent market volatility from holding you back.
If you want to learn more about how you can increase your operation’s financial resiliency, download AgAmerica’s free 2023 farm economy forecast report or speak to one of our land lending experts today.