


(Infographic) The State of American Agriculture
The Census of Agriculture’s Impact on Farm Programs and Policy.
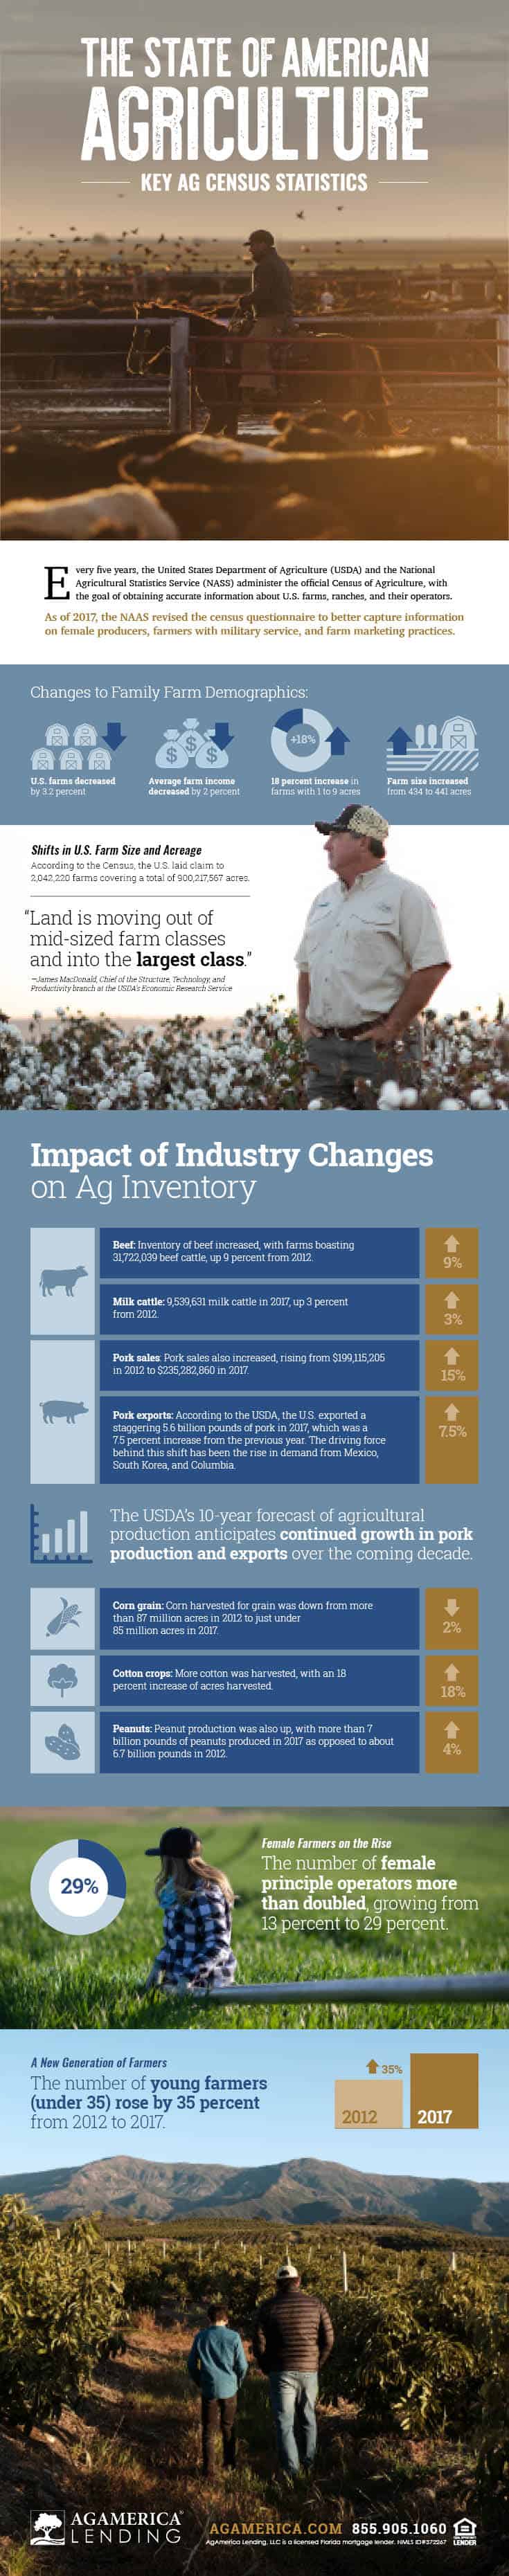
Why is Census data important to American agriculture and its producers? The Census data provides the agriculture industry with a wealth of information, including land use and ownership, farmer demographics, production practices, income, and expenditures. The USDA’s National Agricultural Statistics Service (NASS) collects this farm data, which is used by both stakeholders and legislators to,
- Provide insights on historical trends in agriculture;
- Highlight improvements and needs within the agricultural community;
- Set a baseline for future projections; and
- Shape policy, programs, and allocation for government funding.
Click here to go to infographic.
The NASS Changes Ag Census Questionnaire to Improve Accuracy of Key Statistics
Because the ag Census has a widespread impact on the state of American agriculture, it is critical for the NASS to revise the Census questionnaire before each mailing–to therefore provide equitable representation and capture data points that are relevant to today’s ever-evolving industry.
Learn more about the Ag Census Questionnaire.
How the Agriculture Community Shapes the Census Questionnaire
After the 2012 Agriculture Census, the NASS reviewed feedback from the agriculture community and primary stakeholders to address concerns of potential discrepancies in the farm data. One such concern was the inability to put more than one person as a primary operator, therefore potentially skewing the representation of female operators, younger generations, and minorities.
In 2015, a panel of experts was created to revise the Census questionnaire to more accurately represent the true demographics of U.S. farmers and ranchers. Through deliberation and consideration of stakeholder input, panelists replaced the single primary operator question with a range of questions on-farm management decisions and allowed up to four primary operators. These changes boosted inclusivity and improved accurate representation of the diversity of operators on American farms.
New crops were also added to better represent specialty crops and terminology adjustments were made to improve analytic reporting. Specialty commodities include horses, bees, elk, emus, fish, nursery, and more. An explanation of each section was provided through a Census appendix to ensure information was recorded as accurately as possible. All these adjustments showed several significant findings and statistical shifts within the agriculture community.
2017 Census of Agriculture Key Highlights
Consolidation of America’s Small Farms
The 2017 Census showed both growth and decline in U.S. farm size and acreage. The number of U.S. farms decreased by 3.2 percent. However, average farm size increased 1.6 percent, indicating a trend towards larger farms and a decrease in mid-size farms. Major factors contributing to this farm consolidation include,
- Technology and production capacity;
- Retirement of principal operators; and
- Labor shortage and related expenses.
Female Principal Operators More than Double from 2012 to 2017
Adjustments to the 2017 ag Census, allowing for multiple principal operators, led to a more accurate depiction of the prominent role women play in U.S. agriculture. The number of female principal operators more than doubled from 13 percent to 29 percent. Census revisions were a major factor in this substantial increase, but not the entire reason. The four percent jump in the total number of women in the agricultural workforce indicates a steady growth of females across the industry as a whole.
Learn more about the pivotal role women play in agriculture.
U.S. Farms Witness a Shift in Input Expenses
Another notable highlight from the 2017 Census of Agriculture was the shift in farm input costs. From 2012 to 2017, total production expenses were down from $329 billion to $326 billion. The categories that witnessed the greatest decline in expenses were feed, fertilizer, and fuel.
This data is highly important to the USDA’s 10-year forecast of agricultural production as it paints a clearer picture of how shifts in production expenses affect consumer end-pricing.
Discover key findings from the 2017 Census of Agriculture by downloading a copy of The State of American Agriculture.
Using Farm Data to Make Better Decisions for Your Farm Operation
At AgAmerica we understand the value and role data plays in making financial decisions for your operation. Data provided by the 2017 U.S. Census of Agriculture will continue to impact funding decisions made over the next several years. As the agriculture industry continues to change, we will remain at the forefront, ensuring that our U.S. farmers and ranchers are equipped with resources and key insight to help them position their operations for long-term success. Speak with a loan specialist today to learn how we can help prepare you for a stronger financial future.