


A Regional Overview of U.S. Agriculture
A closer look at regional data for American agriculture highlights the rich diversity that exists within it.
From a sunny citrus grove in Florida to a colorful Washington apple orchard, the U.S. is home to a wide variety of farm operations. That being said, every farm operates differently and faces unique challenges.
To quantify these regional differences and provide clarity for a complex industry, AgAmerica’s Chief Economist Dr. John Penson has collected USDA data for each state in the continental U.S. to evaluate the demographics, expenses, revenue, and farmland trends of each one. This cross-regional analysis sheds light on the unique strengths and challenges of each state and region to help American farmers make more informed business decisions regarding their unique operation. These findings have been consolidated into six regional reports.
Important to Note:
- The data refers to the continental U.S. only and excludes Alaska and Hawaii.
- All numbers are rounded to the nearest whole number or decimal point.
- Data is from 2019 unless otherwise noted.
An Annual Analysis of Six USDA Regions
Before diving into the statistics, it is important to identify the six USDA regions and subregions that are included in these reports:
Midwest
- Corn Belt: Illinois, Indiana, Iowa, Ohio, and Missouri.
- Lake States: Michigan, Minnesota, and Wisconsin.
- Northern Plains: North Dakota, South Dakota, Nebraska, and Kansas.
Delta
Northeast
- Maine
- Vermont
- New York
- Massachusetts
- Connecticut
- Rhode Island
- New Hampshire
- New Jersey
- Pennsylvania
- Delaware
- Maryland
Southeast
- Appalachian: Kentucky, North Carolina, Tennessee, Virginia, and West Virginia.
- Southeast Subregion: Alabama, Georgia, South Carolina, and Florida.
Southern Plains
- Texas
- Oklahoma
West
- Pacific Coast: California, Oregon, and Washington.
- Mountain: Montana, Idaho, Wyoming, Nevada, Utah, Colorado, Arizona, and New Mexico.
U.S. Regional Farm Demographics
A good place to begin our discussion is to examine how key operation demographics vary by region. Here are just a few ranges that illustrate these variations:
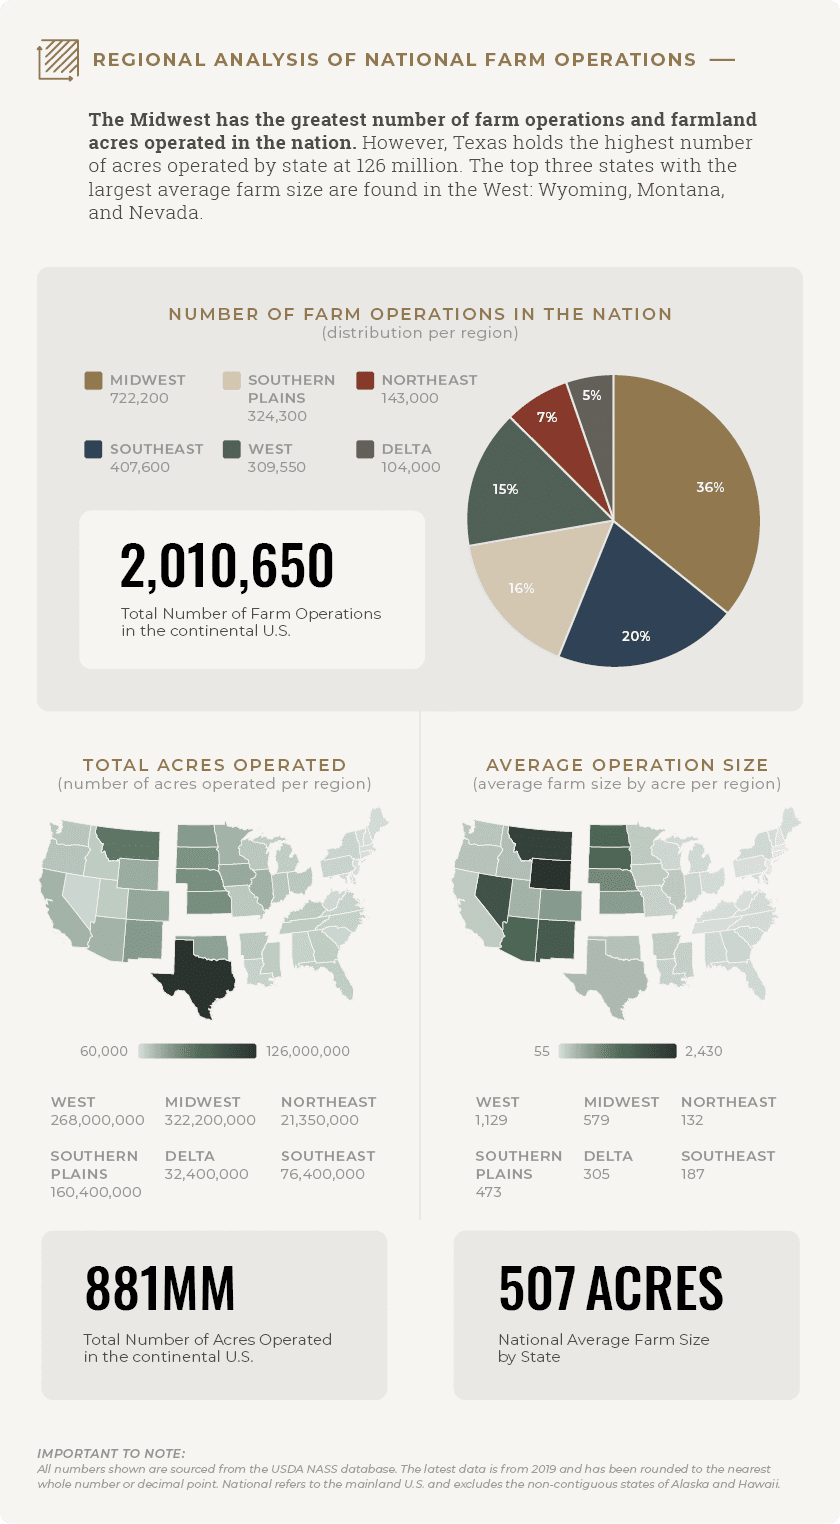
- The total number of acres operated per region ranges from 21,350,000 to 322,200,000, a difference of 300,850,000 acres.
- The average farm size by region also varies with acres ranging from 132 to 1,129.
- The number of farmworkers per region ranges from 198,999 to 1,421,457.
Total Number of U.S. Farms
The more than two million farms in the continental U.S. come in all shapes and sizes, with some operating hundreds of acres and others managing just a few. One overarching theme is the year-over-year trend of farm consolidation. In fact, according to the USDA, the number of farms in 2019 decreased by approximately 5,800 farms from 2018.
Total Number of Acres Operated
The total number of acres operated in the U.S. is not evenly distributed. For instance, the Midwest has the most acres operated, while the Northeast has the least amount. This same pattern holds true for gross agricultural output with the Midwest producing the highest and the Delta producing the lowest. Even though the Southern Plains region has the lowest number of states, it has the third-highest amount of farmland acres in the nation and houses just over 18 percent of U.S. farmland.
Average Farm Size in the U.S.
According to the USDA, in conjunction with a decline in the number of operations, the average farm size increased by one acre in 2019. Similar to the other categories we have discussed, average farm size trends vary by region.
The West is home to the three states with the largest average farm size: Wyoming, Montana, and Nevada. These three states are all located in the Mountain subregion. Interestingly, the Mountain subregion boasts the lowest average pastureland value and the second-lowest average cropland value in the nation. On the other hand, the Northeast houses the three states with the smallest average farm size: Rhode Island, Massachusetts, and Connecticut. In alignment with the prior observation, the Northeast has the highest average farmland prices.
Farm Operators
According to the 2017 Ag Census, the number of primary farm operators in the U.S. totaled over 1.9 million. With more primary farm operators than any other region, the Midwest claims just over 36 percent of the nation’s primary operators. On the other hand, the Delta region has the lowest primary farm operators at only 5.3 percent of the nation’s total.
Farm Organization
Farm organization refers to the type of ownership of each farm operation. For instance, some farms are owned by families while others are not. Overall, the USDA identifies five different farm classifications that influence how each farm operates. In every region, sole proprietorships make up the highest percentage of farm organizations and partnerships compose the second-highest percentage. The Midwest has the greatest number of sole proprietors at 614,652, and the Southeast has the second-highest number of sole proprietors at 358,552. Conversely, the Delta has the lowest number of sole proprietors at 89,613.
The national average by region of farm organizations is as follows:
- Non-Family Corporations: 0.7 percent
- Other (i.e. estates): 2.2 percent
- Family-Held Corporation: 5.4 percent
- Partnerships: 6.6 percent
- Sole Proprietorship: 85.1 percent
At 38,939, the Midwest holds more family-held corporations than any other region. The USDA estimates that around 70 percent of farmland will be transferred to another owner in the next 20 years, making succession planning crucial to the survival of family farms.
Farm Tenure
While some land is owned and other land is rented, the majority of farmers are either full or part owners of their land. In fact, 92.7 percent of farmers own land, and 7.3 percent of farmers rent land.
Below are the national averages by region for farm tenure:
- Tenant Farms: 7.3 percent
- Part Owners: 23.0 percent
- Full Owners: 69.7 percent
Several interesting highlights about regional differences in farm tenure include:
- New Jersey has the highest percentage of Full Owners at 83.2 percent.
- North Dakota has the highest percentage of Part Owners at 42.4 percent.
- Arizona has the highest percentage of Tenant Farms at 56.9 percent.
- By region, the Southeast has the highest percentage of Full Owners at 74.6 percent.
The benefits of land ownership include:
- Having control over your land and the authority to make decisions;
- Increasing the value of your investment through improvements to your property;
- Leveraging your land’s equity to obtain working capital; and
- Having an income-generating asset to pass along to future generations.
AgAmerica values the important role that land ownership plays for American farmers and ranchers and the transformational impact that it can have in the lives of farmers and their families. If you’re considering land ownership, we invite you to explore our helpful financial insights and resources to guide you in your journey.
Farm Labor
Across the six U.S. regions assessed in these farm reports, nearly five million farmworkers contribute to bringing food to our tables.
The national totals for farm labor by classification are:
- Migrant workers: 395,833
- Hired workers: 2,397,176
- Unpaid family workers: 2,157,611
The West has the highest number of hired workers at 876,395 and the greatest number of migrant workers at 197,462. Likewise, the West has the largest percentage of migrant workers at 13.9 percent of their farm workforce. By state, California has more migrant workers than any other state at 105,057. The Southern Plains has the lowest number of migrant workers and highest percentage of unpaid family workers.
At 9.2 percent of total farm input costs, hired farm labor is the third-highest production expense for American farmers. For regions with more migrant workers, immigration policy is especially important to the success of their operations.
Cost and Revenue Breakdown for the Agricultural Industry
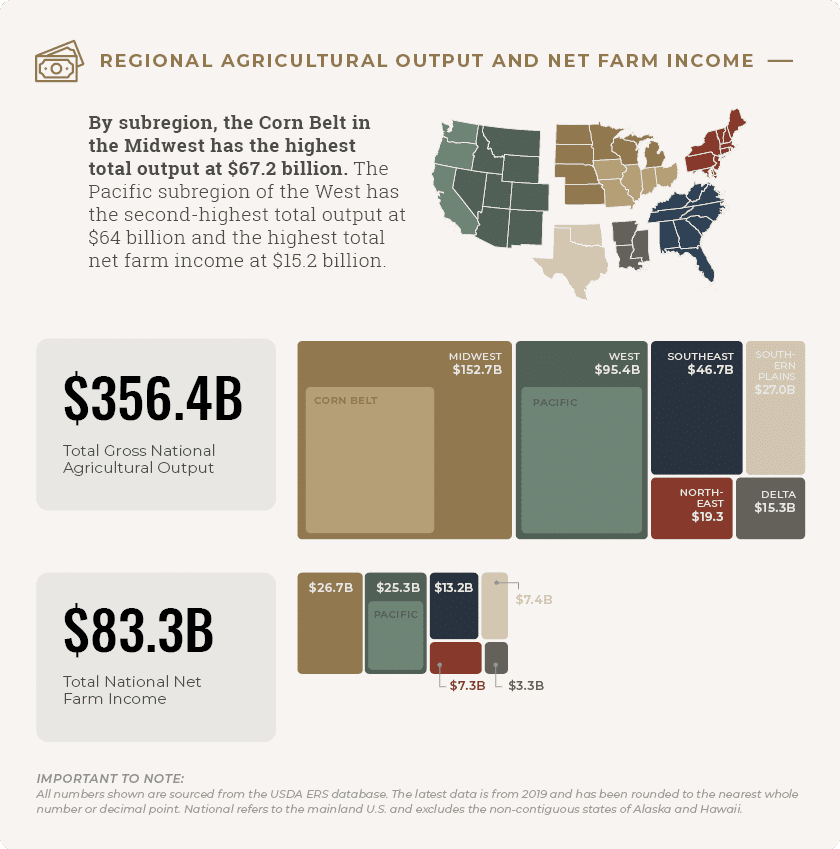
Agricultural Output
The Midwest generates the most agricultural output at 42.8 percent of the national total. All regions retain their rankings for both agricultural output and income. This means that regions with higher output also generate higher net farm income.
Agricultural Income
The Midwest generates 32 percent of the national total of net farm income. The Delta holds the smallest share at 4 percent of the national total. By subregion, the Pacific West has the highest total net farm income with 18.3 percent of the nation’s total.
Federal Aid
In 2019, the national total for direct farm program payments was $21.8 billion. The Northeast had the lowest percentage of the national total while the Midwest had the highest percentage.
5-Year Capitalization Rates
It is important to understand the rate of return on farmland ownership to explore the regional differences in farmland value trends. The range by state for 5-year capitalization rates is 0.8 percent to 12.4 percent.
Some comparison points among regions include:
- The Midwest has the highest 5-year capitalization rate at 8.8 percent;
- Close behind is the Delta region at 8.0 percent; and
- The Northeast has the lowest rate at 2.3 percent.
*Data is not available for Maine, Vermont, Massachusetts, Connecticut, Rhode Island, New Hampshire, Delaware, and Nevada.
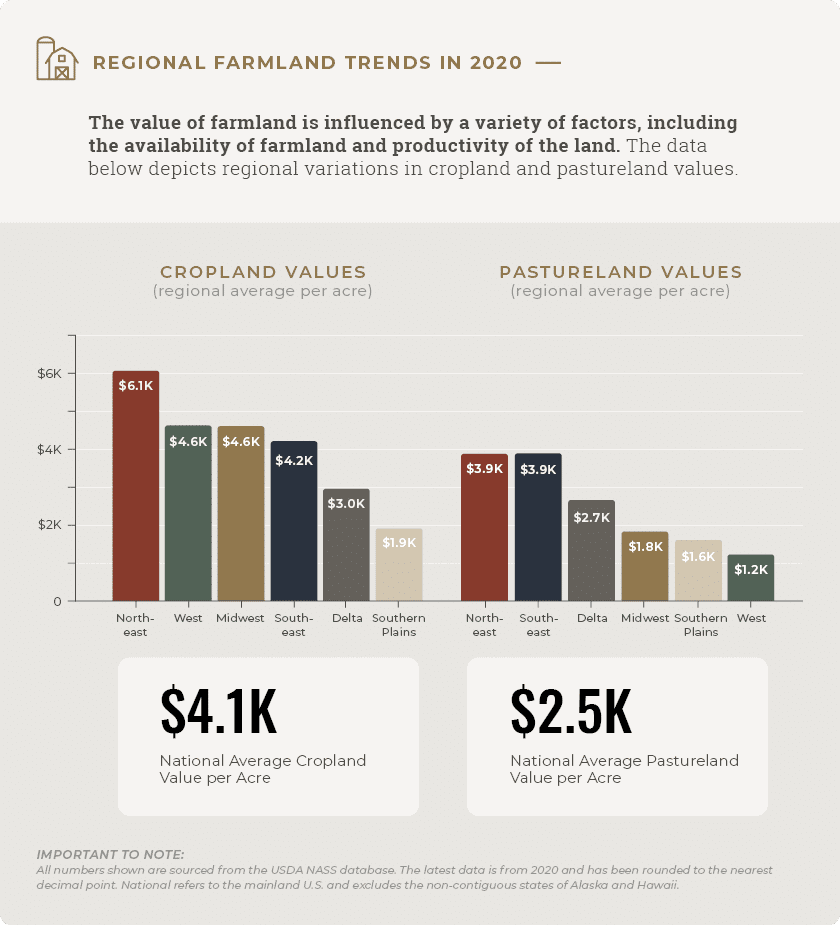
U.S. Farmland Values
U.S. farmland values are influenced by various factors and differ accordingly. Even variables such as soil type can affect land values. For instance, the Northeast has the highest farmland values due to shrinking availability of land. This is in part due to more people wanting to move to rural areas as opposed to crowded urban areas. Productivity of the land is also a major contributing factor of U.S. farmland value trends. For example, the West has the second-highest average cropland value but the lowest average pastureland value. This is likely due to the fact that the West accounts for 31.3 percent of total cash receipts for crop production but only 19.9 percent of total cash receipts for animal products production, translating to higher cropland values in the West.
U.S. Agricultural Export Trade
Because all U.S. regions contribute to the total U.S. agricultural export output, trade is a topic of importance for all regions. In 2019, U.S. agricultural exports totaled 123.9 billion. The Midwest had the highest exports at 47.8 billion while the Northeast had the lowest at 6.1 billion. However, California had more exports than any other state at $23.5 billion. California is a top exporter of tree nuts, fresh and processed fruits, and processed vegetables. The top five states most reliant on export trade are California, Iowa, Illinois, Minnesota, and Texas.
Total agricultural exports by region in 2019 are:
- Northeast: $6.1 billion
- Delta: $6.5 billion
- Southern Plains: $8.1 billion
- Southeast: $17.2 billion
- West: $38.1 billion
- Midwest: $47.8 billion
As the remainder of 2021 unfolds, it is important to keep the multifaceted nature of U.S. agriculture in mind and examine the many different components that affect the industry. With so much variation, considering these regional differences is crucial to effective decision-making.
A Nationwide Lender with a Customized Approach
With over two million farm operations across these six U.S. regions, the differences in concerns and challenges U.S. farmers and ranchers face are vast. The unique needs and desires of farmers vary by operation, creating the need for a lender that understands these differences. AgAmerica raises the standards with U.S. agriculture loans tailored to the unique needs of American farmers and ranchers nationwide.
Read our regional whitepapers by downloading a free copy and explore the strengths, challenges, and variation that exists in the U.S. agriculture community.